Introduction
Modern businesses rarely operate with a single, clean dataset. Marketing data sits in ad platforms, leads live in CRMs, orders come from billing systems, and customer behaviour is captured through web analytics tools. When stakeholders ask a simple question such as “Which campaign brought the highest-paying customers?” the answer usually requires more than one source. This is where data blending becomes essential.
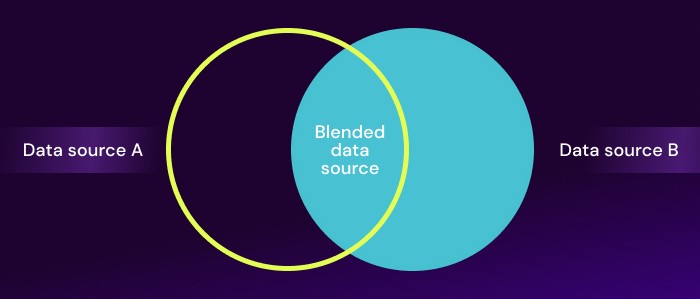
Data blending is the process of combining information from multiple sources to create one unified view for analysis and reporting. It helps you connect the dots across systems without losing important context. For learners exploring data analytics coaching in bangalore, understanding data blending is a key step toward working with real-world datasets, where perfect tables and neat columns are not guaranteed.
What Data Blending Actually Means
Data blending brings together datasets that were created for different purposes. The goal is not just to “merge files,” but to align data using shared fields so you can analyse them together. For example:
- Joining website sessions (Google Analytics) with leads (CRM) using landing page or campaign parameters
- Combining sales transactions with customer profiles using Customer ID
- Bringing together branch-level performance, staffing data, and operational costs to evaluate profitability
A blended view can be created in tools like Excel (Power Query), Power BI, Tableau, Looker Studio, or even SQL-based pipelines. In many analytics workflows, blending sits between raw data collection and final dashboards.
Blending vs. Joining: A Helpful Distinction
People often mix up terms like blending, merging, and joining. While they overlap, there are practical differences:
- Joining usually refers to database-style combinations (SQL joins) where tables are combined at the row level using keys.
- Blending is often used when sources are different systems, and the combination happens at the reporting layer or after some aggregation.
- Merging is a general term that can mean either, depending on context.
For example, in BI tools you might blend data at a visualisation level where one source is the primary dataset and the other is added based on matching fields. In Excel or Power Query, you are effectively joining tables to create a single model. In data analytics training in bangalore, you will often learn both the conceptual difference and the practical techniques, because different tools handle blending differently.
Common Use Cases Where Data Blending Adds Value
Data blending matters most when a single metric depends on multiple systems. A few common scenarios:
1) Marketing-to-Sales Attribution
Marketing teams track clicks and leads, while sales teams track closures and revenue. Blending ad spend, lead quality, and revenue helps answer questions like:
- Which campaign generates customers with the highest lifetime value?
- Which channel has low CPL but also low conversion to paid customers?
2) Customer 360 View
A “single customer view” typically requires blending:
- Customer profile data (CRM)
- Purchase history (billing/ERP)
- Support tickets (helpdesk tools)
- Behavioural data (web/app analytics)
This helps teams understand churn risk, upsell opportunities, and customer satisfaction in one place.
3) Operational Performance Reporting
Operations often require blending daily production, staffing, delivery times, and defect rates. A combined view helps identify whether delays are driven by supply, people, or process issues.
These examples highlight why learners in data analytics coaching in bangalore benefit from practising blending early. It mirrors how analytics is done in organisations.
The Key Steps in a Reliable Data Blending Workflow
A successful blend is not just about connecting tables. It requires a few disciplined steps:
1) Define the Business Question First
Start with what you want to measure. For instance, “Revenue by campaign” needs campaign data, lead mapping, and transaction revenue. Without a clear question, blending often becomes an endless attempt to connect everything.
2) Identify Shared Keys and Granularity
A shared key could be Customer ID, Order ID, Email, Campaign ID, or even Date + Branch. But key matching only works if the data is at a compatible level of detail.
Granularity mismatches are common. For example:
- Website sessions are at session level
- Leads are at person level
- Sales are at transaction level
If you blend without planning, you can accidentally duplicate rows and inflate totals.
3) Clean and Standardise Before Combining
Common fixes include:
- Aligning date formats and time zones
- Standardising naming conventions (e.g., “FB Ads” vs “Facebook”)
- Removing extra spaces and inconsistent casing
- Handling missing IDs or duplicates
Most blending failures happen because keys do not match cleanly.
4) Choose the Right Relationship Type
Depending on the scenario, you might need:
- One-to-one (rare but clean)
- One-to-many (common, like customer to transactions)
- Many-to-many (riskier, requires careful modelling)
In BI tools, relationship design strongly affects how totals and filters behave.
Typical Challenges and How to Avoid Them
Data blending introduces risks if done casually. Here are common problems and fixes:
- Duplicate records and inflated totals: Check for duplicated keys and ensure your join fields are unique where needed.
- Missing matches: Use audit checks to see how many rows matched and how many did not. Investigate nulls.
- Inconsistent definitions: Ensure “revenue” and “customer” mean the same thing across teams.
- Data freshness issues: Different systems refresh at different times. Document refresh schedules clearly.
Strong habits here are often emphasised in data analytics training in bangalore, because they directly influence trust in dashboards.
read more : Mitigating the Influence of Outliers on Parameter Estimation in Linear Models
Conclusion
Data blending is a practical skill that helps you create one coherent story from scattered systems. It enables better decision-making by connecting marketing, sales, product, finance, and operations into a unified analytical view. The most important factors are clarity on the business question, matching granularity, clean keys, and careful validation after combining sources.
If you are building job-ready analytics capability through data analytics training in bangalore, treat blending as a core competency, not an optional technique. The ability to combine multiple sources into a single, reliable view is what separates basic reporting from meaningful analysis.
Business Name: ExcelR – Data Science, Data Analytics Course Training in Bangalore
Address: 49, 1st Cross, 27th Main, BTM Layout stage 1, Behind Tata Motors, Bengaluru, Karnataka 560068
Phone Number: 09632156744
